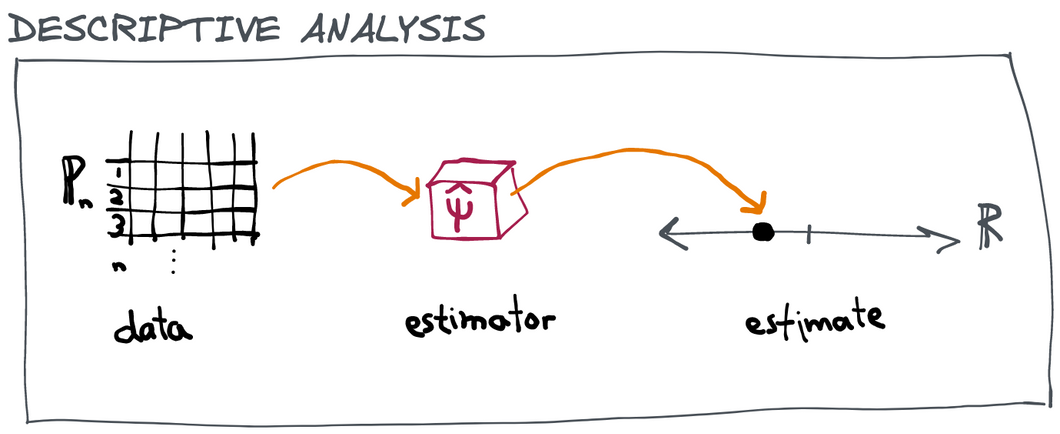
A descriptive analysis is what we call any transformation of observed data into a summary number (or numbers) that doesn't require an "imaginary world" to interpret. Maybe that sounds a little abstract but hopefully when we contrast it with an inferential analysis later you'll see what we mean.
A descriptive analysis only has three components:
Data: some measurements about the real world (e.g. a spreadsheet with rows representing subjects in a clinical trial and columns representing their measured characteristics)
Estimator: a fixed algorithm or process or function that takes data and returns a number (e.g. a function like mean() in R or python that takes data as an input and returns one number)
Estimate: the summary number that is returned (e.g. the mean age of the subjects in our trial dataset)
As another example, consider obtaining a dataset that contains the daily high temperature in San Francisco for every day in 2021 () and taking the average of all those temperatures: . Here the data are the measurements , the estimator is the function , and the estimate is the average . At this point there isn't any notion of what it is we are "estimating". The estimate is just a transformation of the data we observe, we haven't connected it in any way to some hidden property of the real world.
Data
In general each data point may itself be a vector of variables instead of a scalar. A running example that we'll use throughout is the case where we're observing a sample of individuals, each of whom has a vector of baseline covariates , receives a treatment , and then experiences some outcome . For example, we might imagine that we're looking at a group of people who all presented to the emergency room with difficulty breathing. The baseline covariates might include a person's age, sex, and weight, the treatment might be whether or not that person was admitted to the hospital, and the outcome could be whether or not the person recovered from their illness within the week. In this case, the data are observations of the tuple .
Instead of writing out to denote the full set of data, we'll often use the symbol or more often just for short. This symbol represents a probability distribution that places mass at each observed . As long as the order of the observations doesn't matter, for any given dataset there is exactly one empirical distribution that represents it, and vice versa, so we capture everything we need with this formalism. Writing is easier than and it turns that thinking of the data as an empirical distribution also has conceptual benefits that we will exploit later.
Estimator
An estimator can be any function of the full dataset. In the example above, we returned an average, but we could compute any kind of summary and call it an estimator. For example, we could compute a max, or a range, or a median, or even do something much more complex. For example, if we have data we might do a linear regression of the values onto the matrix of covariates and extract the coefficient for .
In general we use the notation to denote a function that ingests a dataset and returns a number. We can also just as easily define estimators that return multiple numbers at once, or that return a function, or anything else. These are no different, really, so throughout this book we'll stick to estimators that return real numbers for simplicity.
Estimate
The estimate is just whatever the estimator returns! It may or may not have a meaningful interpretation, and we'll get into that shortly. The estimate is denoted . Sometimes, in an abuse of notation, we'll just say when really we mean . It should be clear from context what is being referred to (the estimator or the estimate ).
